Wednesday, July 12, 2006
Fear of Terrorism
Fear of terrorism varies greatly across the US, and this variation lies at the heart of many current political disagreements. Many Americans seem terrified that terrorists are going to strike, and, as such, are willing to support almost any policy which claims to fight terrorism -- e.g., a war in Iraq, torturing people, spying on Americans, etc.. Oddly, the places with the most obvious terror targets seem the least willing to support such policies.
Today's release of the report on the National Asset Database (aka the terror target list) provides an interesting glimpse of these differences. The headlines are awash in some of the more absurd potential terror targets like Old MacDonald’s Petting Zoo, the Amish Country Popcorn factory, the Mule Day Parade, the Sweetwater Flea Market. Meanwhile, presumably important sites like the Statue of Liberty and Times Square fail to make the list. Apparently, much of the list was submitted by the states. As such, the differences in what places listed as potential targets reflects, with a fair amount of noise, how different places think about terrorism.
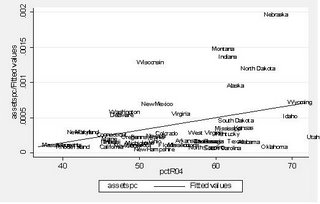
Ultimately, when I added the data on number of "assets" by state to data on population and support for George W. Bush in 2004 and plotted assets per capita against percent voting for W., I was not surprised to find the relationship depicted below.

I am not sure how to interpret this, but I thought it was interesting.
Today's release of the report on the National Asset Database (aka the terror target list) provides an interesting glimpse of these differences. The headlines are awash in some of the more absurd potential terror targets like Old MacDonald’s Petting Zoo, the Amish Country Popcorn factory, the Mule Day Parade, the Sweetwater Flea Market. Meanwhile, presumably important sites like the Statue of Liberty and Times Square fail to make the list. Apparently, much of the list was submitted by the states. As such, the differences in what places listed as potential targets reflects, with a fair amount of noise, how different places think about terrorism.
Ultimately, when I added the data on number of "assets" by state to data on population and support for George W. Bush in 2004 and plotted assets per capita against percent voting for W., I was not surprised to find the relationship depicted below.

I am not sure how to interpret this, but I thought it was interesting.
Subscribe to Comments [Atom]